Note
Go to the end to download the full example code.
Creating Interactive Virtual Images#
We can create interactive virtual images by using the interactive method from hyperspy. Because this requires that we recalculate the virtual images every time we change the ROIs it works best with small datasets or datasets loaded completely into memory.
You can drag the ROI to update the virtual image if you use the ipympl or qt5 backends for plotting!
import pyxem as pxm
import hyperspy.api as hs
s = pxm.data.dummy_data.get_cbed_signal()
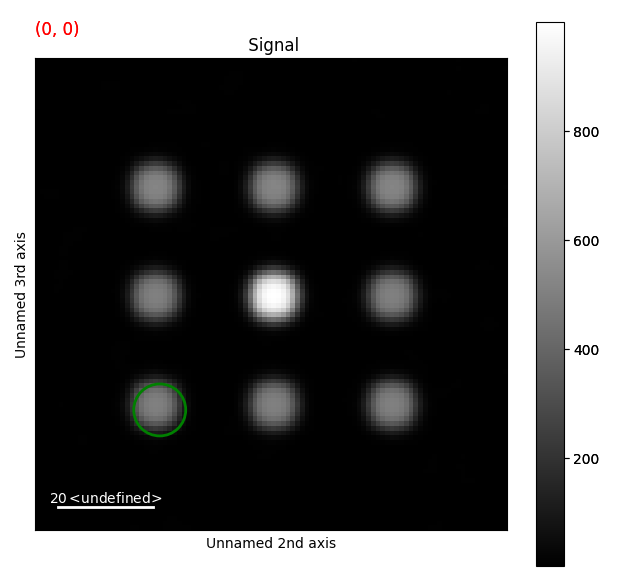
circle = hs.roi.CircleROI(cx=26, cy=74, r=5.5, r_inner=0)
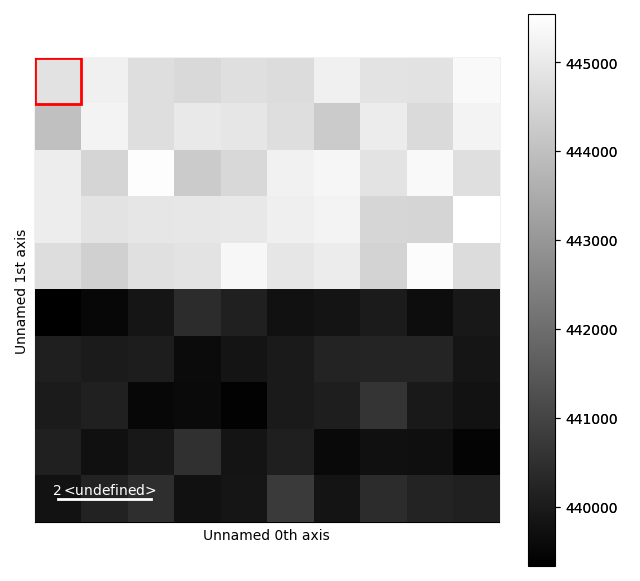
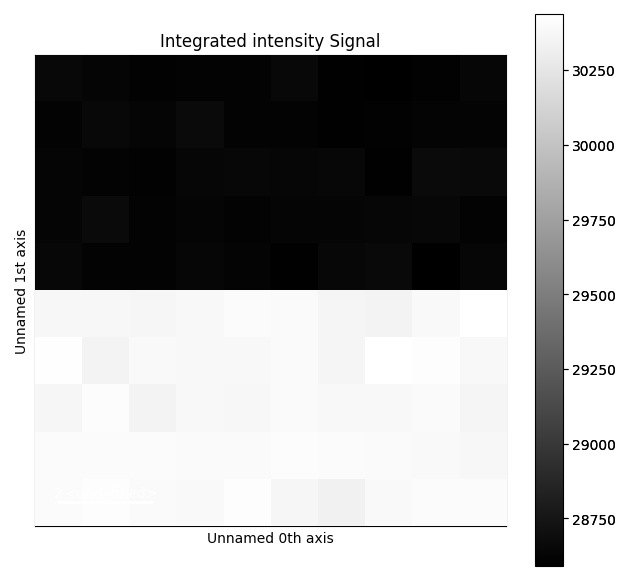
s.plot_integrated_intensity(circle)
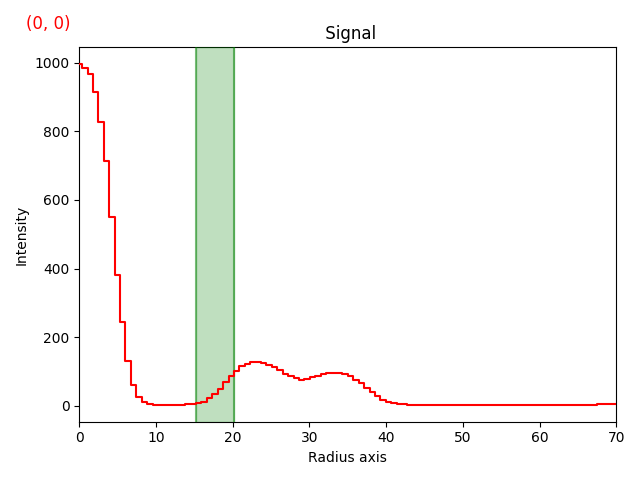
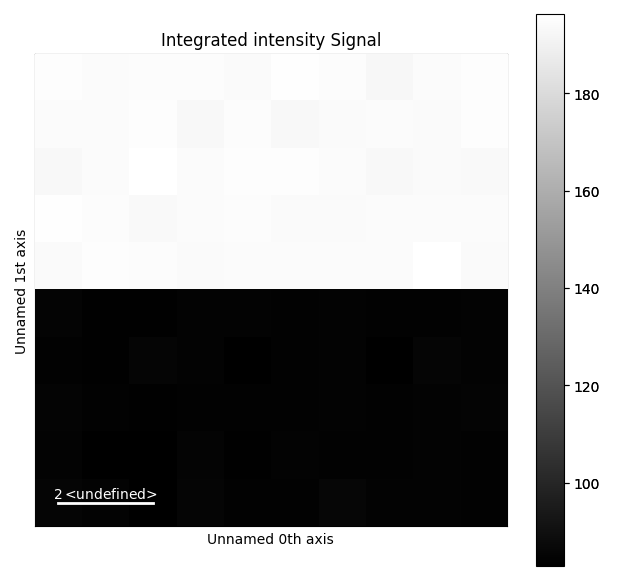
# Also we can do the same with a 1D signal
s = pxm.data.dummy_data.get_cbed_signal()
s.calibrate(center=None)
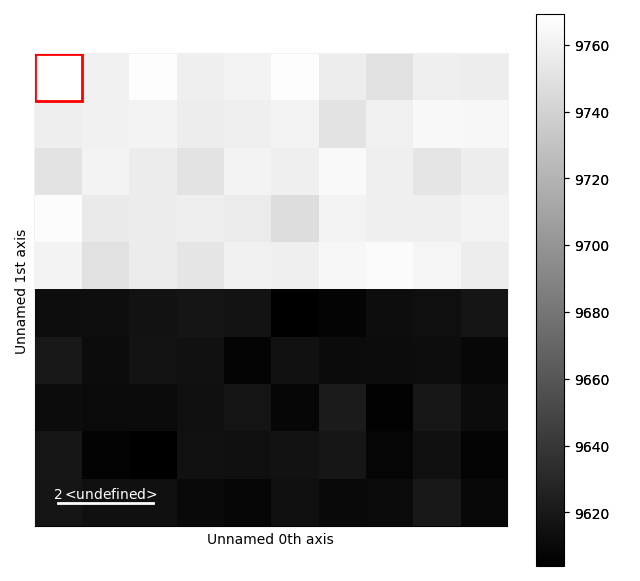
s1d = s.get_azimuthal_integral1d(npt=100, mean=True)
span = hs.roi.SpanROI(left=15.5, right=20)
s1d.plot_integrated_intensity(span)
[                                        ] | 0% Completed | 151.30 us
[                                        ] | 0% Completed | 109.17 ms
[########################################] | 100% Completed | 209.51 ms
Total running time of the script: (0 minutes 11.686 seconds)