Note
Go to the end to download the full example code.
Creating Virtual Images from Vectors#
In this example we will show how to create virtual images from vectors. We will use the find_peaks method to find the vectors and then use the get_unique_vectors method to reduce the number of vectors to a unique set of vectors.
We can convert the unique vectors to regions of interest (ROIs) objects using the to_roi method and then use the get_virtual_image method to create the virtual images.
This method is flexible and any type of ROI defined in hyperspy can be used to create virtual images.
We also included the include_labels argument to the to_roi method which will also return the labels for each ROI for use plotting on the signal.
import pyxem as pxm
c = pxm.data.dummy_data.get_cbed_signal()
pks = c.template_match_disk(5, subtract_min=False).find_peaks(
interactive=False, threshold_abs=0.8, min_distance=6
)
dv = pxm.signals.DiffractionVectors.from_peaks(pks)
vectors = dv.get_unique_vectors()
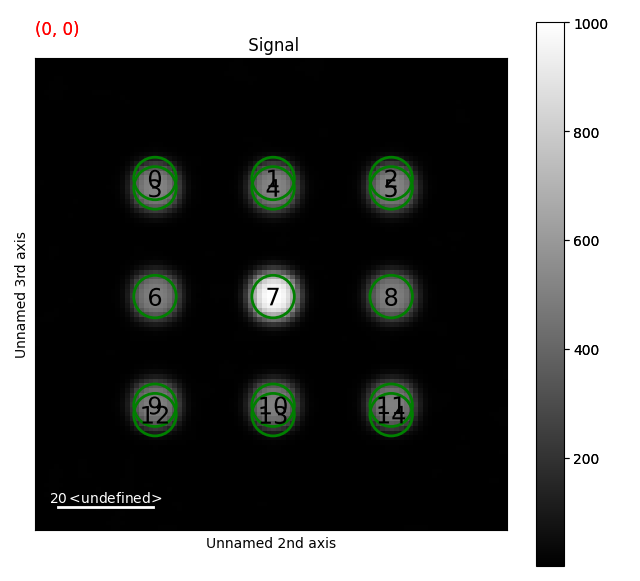
roi, texts = vectors.to_roi(radius=5, include_labels=True, sizes=3, facecolor="black")
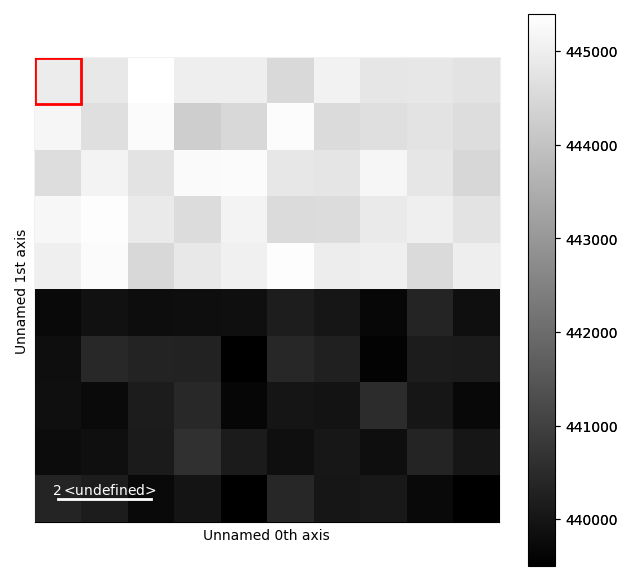
c.plot()
for r in roi:
r.add_widget(c, axes=(2, 3))
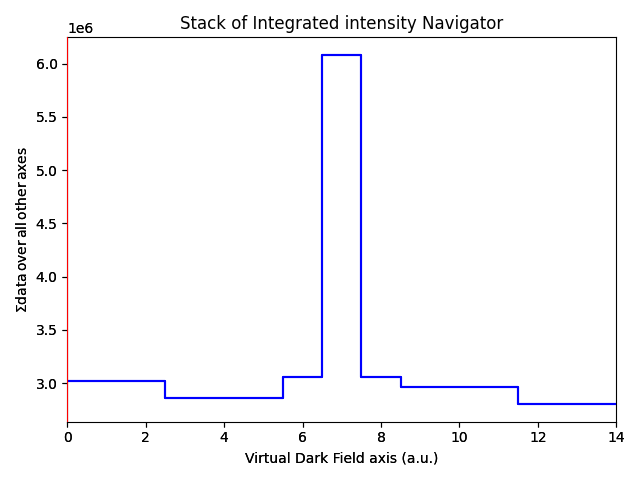
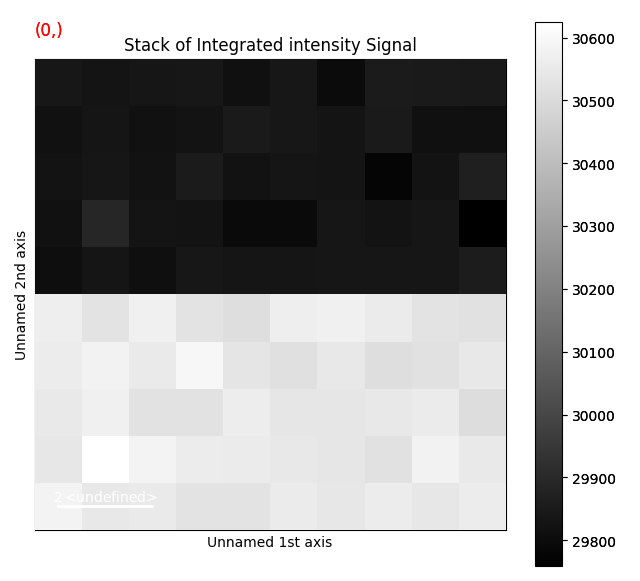
vdfs = c.get_virtual_image(roi)
c.add_marker(texts)
[                                        ] | 0% Completed | 139.69 us
[                                        ] | 0% Completed | 100.45 ms
[########################################] | 100% Completed | 200.82 ms

[                                        ] | 0% Completed | 135.71 us
[########################################] | 100% Completed | 100.40 ms

[                                        ] | 0% Completed | 126.48 us
[########################################] | 100% Completed | 100.41 ms
vdfs.plot()
sphinx_gallery_thumbnail_number = 2
Total running time of the script: (0 minutes 3.806 seconds)