Note
Go to the end to download the full example code.
Operations on Vectors#
This example shows how to perform some basic operations slicing and selecting vectors. This is designed to be very flexible and powerful. Many operations such as slicing with a boolean array are supported.
Additionally, lazy operations are supported and can be chained together. These are often faster
than their non-lazy counterparts as dask very effectively prunes the computation graph.
import pyxem as pxm
import hyperspy.api as hs

hs.set_log_level("ERROR")

s = pxm.data.tilt_boundary_data()
temp = s.template_match_disk(disk_r=5, subtract_min=False)

vectors = s.get_diffraction_vectors(threshold_abs=0.4, min_distance=5)
  0%|          | 0/33 [00:00<?, ?it/s]
 52%|█████▏    | 17/33 [00:00<00:00, 155.44it/s]
100%|██████████| 33/33 [00:00<00:00, 138.76it/s]
100%|██████████| 33/33 [00:00<00:00, 140.95it/s]

  0%|          | 0/33 [00:00<?, ?it/s]
 33%|███▎      | 11/33 [00:00<00:00, 99.13it/s]
 64%|██████▎   | 21/33 [00:00<00:00, 83.46it/s]
 91%|█████████ | 30/33 [00:00<00:00, 84.73it/s]
100%|██████████| 33/33 [00:00<00:00, 87.67it/s]

  0%|          | 0/33 [00:00<?, ?it/s]
100%|██████████| 33/33 [00:00<00:00, 9757.63it/s]
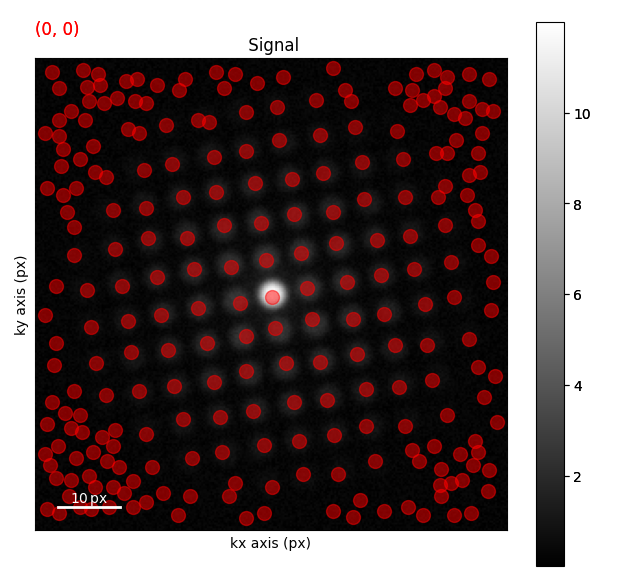
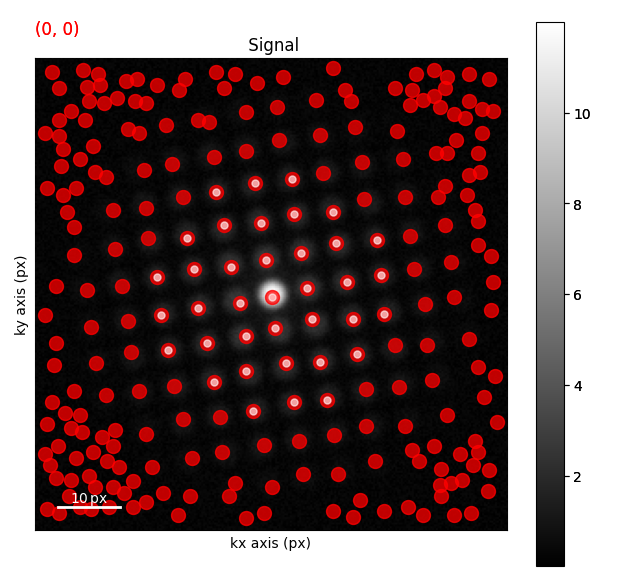
Plotting all the vectors
s.plot()
all_vectors = vectors.to_markers(color="red", sizes=10, alpha=0.5)
s.add_marker(all_vectors)
  0%|          | 0/33 [00:00<?, ?it/s]
100%|██████████| 33/33 [00:00<00:00, 11774.74it/s]
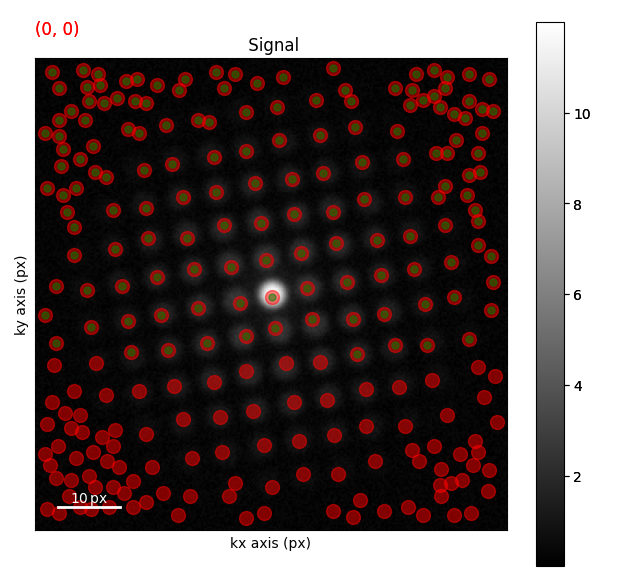
slic_vectors = (vectors.ivec[:, vectors.ivec[0] < 10]).to_markers(
    color="green", sizes=5, alpha=0.5
)

s.plot()
s.add_marker([all_vectors, slic_vectors])

  0%|          | 0/33 [00:00<?, ?it/s]
100%|██████████| 33/33 [00:00<00:00, 12489.81it/s]

  0%|          | 0/33 [00:00<?, ?it/s]
100%|██████████| 33/33 [00:00<00:00, 11992.03it/s]

  0%|          | 0/49 [00:00<?, ?it/s]
100%|██████████| 49/49 [00:00<00:00, 12543.23it/s]

  0%|          | 0/33 [00:00<?, ?it/s]
100%|██████████| 33/33 [00:00<00:00, 8058.92it/s]
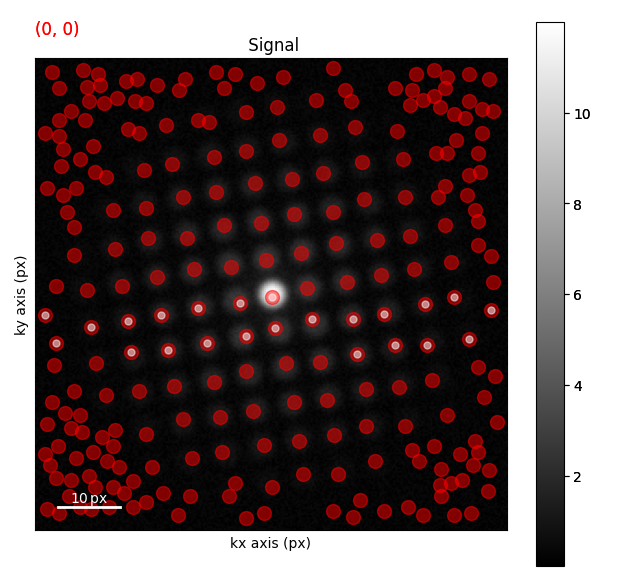
slic_vectors = (
    vectors.ivec[:, (vectors.ivec[0] > 0) * (vectors.ivec[0] < 10)]
).to_markers(color="w", sizes=5, alpha=0.5)
s.plot()
s.add_marker([all_vectors, slic_vectors])

  0%|          | 0/33 [00:00<?, ?it/s]
100%|██████████| 33/33 [00:00<00:00, 13308.85it/s]

  0%|          | 0/33 [00:00<?, ?it/s]
100%|██████████| 33/33 [00:00<00:00, 8426.91it/s]

  0%|          | 0/33 [00:00<?, ?it/s]
100%|██████████| 33/33 [00:00<00:00, 13097.28it/s]

  0%|          | 0/33 [00:00<?, ?it/s]
100%|██████████| 33/33 [00:00<00:00, 11785.77it/s]

  0%|          | 0/49 [00:00<?, ?it/s]
100%|██████████| 49/49 [00:00<00:00, 12933.16it/s]

  0%|          | 0/33 [00:00<?, ?it/s]
100%|██████████| 33/33 [00:00<00:00, 12335.09it/s]
vect_magnitudes = (vectors.ivec[0] ** 2 + vectors.ivec[1] ** 2) ** 0.5
slic_vectors = vectors.ivec[:, vect_magnitudes < 20].to_markers(
    color="w", sizes=5, alpha=0.5
)
s.plot()
s.add_marker([all_vectors, slic_vectors])
s.add_marker([all_vectors, slic_vectors])

  0%|          | 0/33 [00:00<?, ?it/s]
100%|██████████| 33/33 [00:00<00:00, 12870.75it/s]

  0%|          | 0/33 [00:00<?, ?it/s]
100%|██████████| 33/33 [00:00<00:00, 13693.32it/s]

  0%|          | 0/33 [00:00<?, ?it/s]
100%|██████████| 33/33 [00:00<00:00, 12349.40it/s]

  0%|          | 0/49 [00:00<?, ?it/s]
100%|██████████| 49/49 [00:00<00:00, 12066.04it/s]

  0%|          | 0/33 [00:00<?, ?it/s]
100%|██████████| 33/33 [00:00<00:00, 12248.85it/s]
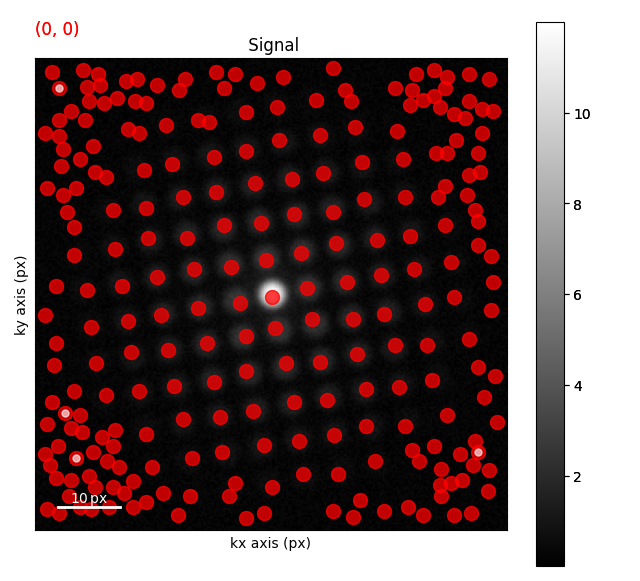
slic_vectors = (vectors.ivec[:, vectors.ivec["intensity"] < 0.5]).to_markers(
    color="w", sizes=5, alpha=0.5
)
s.plot()
s.add_marker([all_vectors, slic_vectors])
s.add_marker([all_vectors, slic_vectors])

  0%|          | 0/33 [00:00<?, ?it/s]
100%|██████████| 33/33 [00:00<00:00, 13599.14it/s]

  0%|          | 0/33 [00:00<?, ?it/s]
100%|██████████| 33/33 [00:00<00:00, 12806.44it/s]

  0%|          | 0/49 [00:00<?, ?it/s]
100%|██████████| 49/49 [00:00<00:00, 13953.49it/s]

  0%|          | 0/33 [00:00<?, ?it/s]
100%|██████████| 33/33 [00:00<00:00, 13124.60it/s]
sphinx_gallery_thumbnail_number = 8
Total running time of the script: (0 minutes 2.989 seconds)